

Jan 15, 2016
Performance analysis in sport is still a relatively new discipline within sports science, but an area that has picked up momentum rapidly. Sport is surrounded with mass data collection covering anything and everything. You will have all seen a heat map displaying the possessions of Cristiano Ronaldo playing for Real Madrid, how many unforced errors Nick Kyrgios has made during a set, how many offloads Corey Parker has done for the season and without a doubt you will have all seen the time Usain Bolt runs the 100m. These are all great for the average consumer, but they are all pointless without adding additional detail and expert information from the coaching staff. This blog will aim to give readers an insight into how basic data collection of an athlete’s performance can be used to monitor performances throughout a season in rugby league.
The concept of scoring player performances is not new. Soccer has its traditional out of 10 performance scale, which fans of the EA Sports game FIFA will no doubt check through their man of the match and take note of their player ratings. How does an athlete’s performance determine their overall match score? Around 4 or 5 years ago now I was lucky enough to be recruited as a performance analyst working on the international stage. One fundamental problem that was outlined by the coaching staff was that they needed to keep track of all qualified players across multiple competitions. There was plenty of quantitative and qualitative information available for analysis; the idea was to filter through what information was relevant and how it could be used. Most sports now have a holistic analysis provider that covers all aspects of individual and team performances. The system that was used in rugby league was Opta. This provided in-depth analysis that included all players. The ideal process would be to analyse each player’s performance using a bespoke system, but due to time constraints and the lack of manpower, it was hard to implement. By having Opta provide all performance actions in a quantitative measure, it was now down to the analysis. Using some basic correlations between actions performed on the field and match outcomes a scoring system was implemented with appropriate weightings. To win in rugby league, you need to score more points than the opposition team, so it was no surprise that scoring tries had the highest correlation to a successful performance. For ease, let’s suggest that a try was 10 points and an action that led to the opposition scoring a try (a missed tackle for example) was -10 points. Points were then awarded to each action to give a player an overall match rating score (MRS).
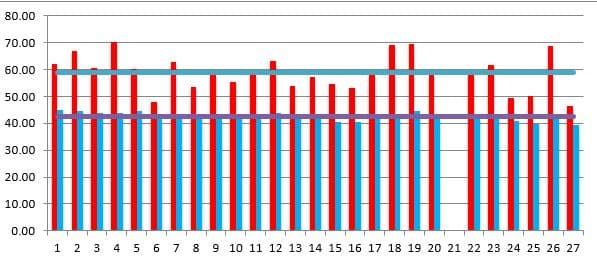
So we have the score, we have the video of all the games, and we now have a database stretching as long as Opta has been the service provider to the sport. The coaching staff bought into the system based on the data that was shown. A key selling point was the graph below, which identified the average player performance compared to the international squad that was picked for that year. The red represented the average performance of all players in the squad, where the blue represented the average performance of all players in the competition. The data showed that the squad selected performed 37.97% better than the average player, thus justifying the coaching staff’s selection.
This information was then used on all previous Opta data at the international level, and any new fixtures were added as they were played. This database was able to identify that the average score of a player when the team won was 63.84, where only one incident over a four-year period showed that the team lost when this target was achieved. This gave the coaching staff the one number performance score to be able to help with decisions around player selection for the squad. This has been an ongoing process for five years now and has resulted in the team taking a scalp of the number 1 ranked team in the world. The graph below shows the point’s difference between the top 2 teams in the world and how it has changed since 2011.
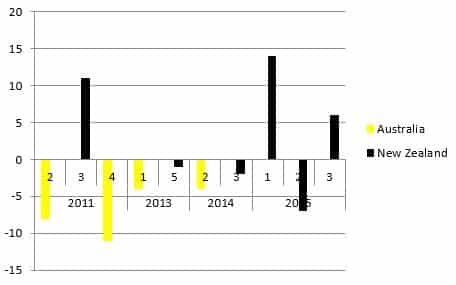
Readers may see large similarities between the story of Moneyball, which since the emergence of the book in 2003 and even more recently in the Brad Pitt blockbuster released in 2011, has been a hot topic in the sport. By no means are these scorings systems the answer to all of the selection headaches that coaching staff go through, but it is something that is there to assist and offer guidance on selection policies by providing objective data to take away the emotional decisions all humans are susceptible to. It has been a long and gruelling process since 2011, but a point’s difference that seems to be getting closer sets up for an exciting Four Nations tournament in 2016.