Introduction
Thanks for stopping by! I am blogging to share my experiences with you on how I started in Analytics and hoped it would inspire others to reach out and do the same.
How did I get into Analytics?
Four years ago while working as a Senior Analyst within a large insurer, I was tasked with cutting SAS code to answer questions that business partners had. Why is my revenue ahead or behind budget? Could it be due to the volume or price or mix of new business?
The trouble with this was that it took considerable effort and days to get answers to simple questions. I thought that there must be a better way, so I went online and discovered Tableau. For those new to Tableau, it is best described as a pivot table on steroids! Download it and give it a go. You can directly load data into the tool and then it draws fantastic looking graphs almost immediately.
Don’t take my word for it, go and download the product and see how it works for yourself!
Having used Tableau with SAS for a few years, I came upon another tool called Alteryx. One night, I came across a presentation by a BCG consultant at Alteryx Inspire 2014 conference, and it sparked my interest on how I could be using it within my company to help business users get the answers they needed faster.
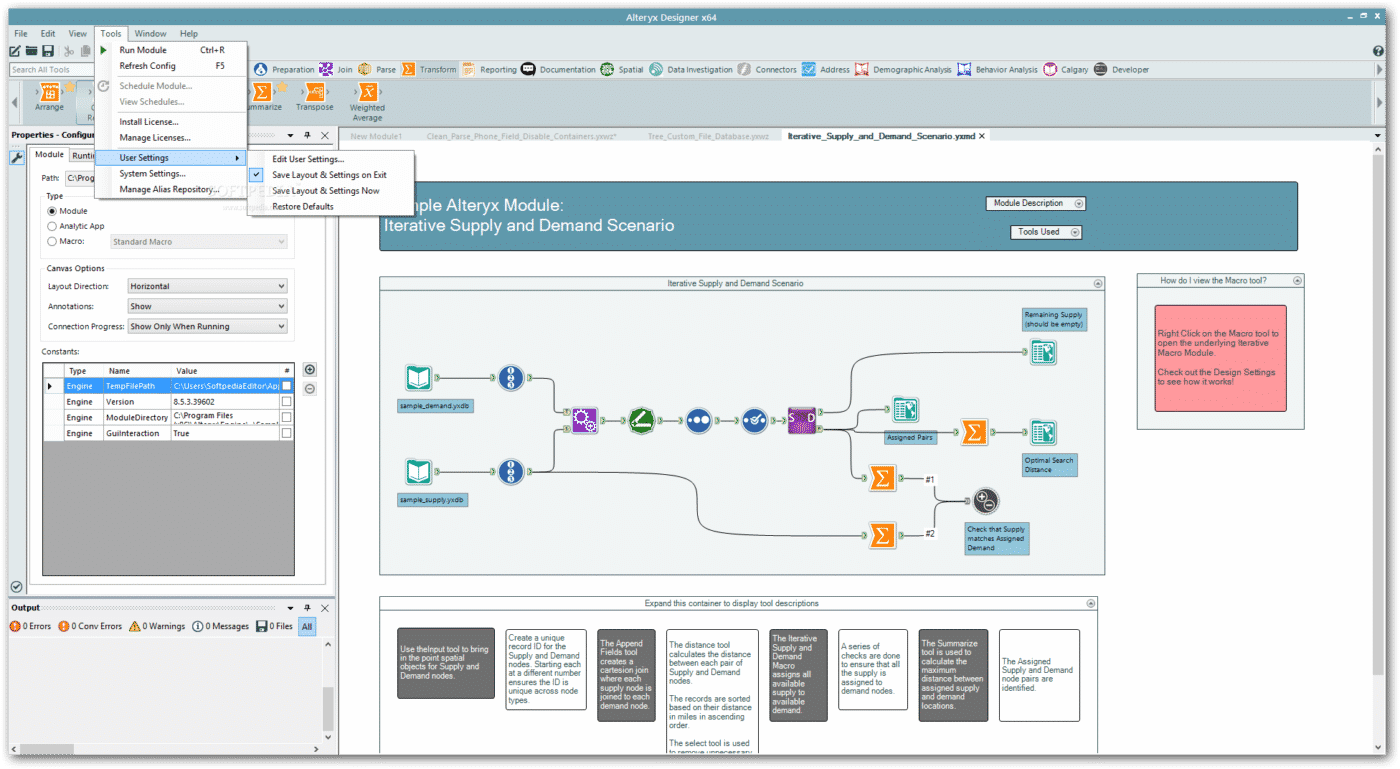
For those new to Alteryx, It can be best described as a graphical drag and drop workflow that can be used to combine and phrase numerous data sources together in an easy to use way so that anyone can use it!
Alteryx is a 3 in 1 product supporting data preparation, spatial analytics and predictive analytics. It works fantastically well with Tableau.
Don’t try and do everything yourself! Buy world class products that can make your analytics lives easier!

")
")

")

