
Nov 7, 2018
Women in Data: Yellowfin BI – From the type writer to Automated Analytics.
Automated Analytics will become more relevant than reports and dashboards for human analysis over the next three years.
At the most recent Woman in Data event, Glen Rabie CEO/Co-founder of Yellowfin spoke about the future of analytics. Glen covered the analytics revolution, evolving from the type writer to automated analytics, data journalism and what comes next.

Yellowfin are not only a proud sponsor of the Women in Data event, but they also provide a single, integrated enterprise analytics platform for delivering faster, better insights for the whole business. Regardless of function or industry. The below is an overview of what Glen spoke about to a crowd of 150+ at the Macquarie Bank, Shelley Street offices.
We all know that there is plenty of data in the world to play with but for it to have context to the average Joe, visualisation is the only answer! There are various tools available on the market to help recognise correlations, trends and patterns in the data. A significant change from the old school type writer to the new school visualisation. To take it one step further, automation of analytics.
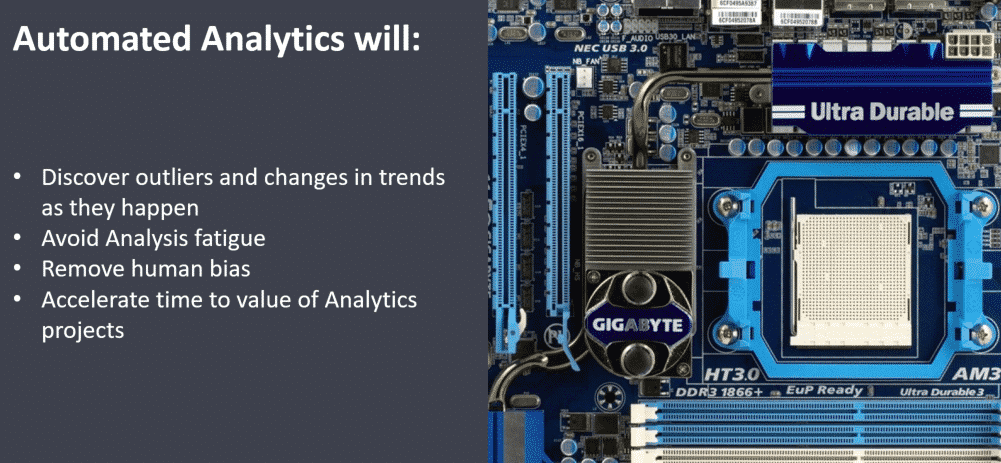
There is such a wide variety of data being collected; from the way we commute to work, to what time we go to the supermarket, the movies we watch on Netflix and much more! Most organisations out there have plenty of data to play with, the essential part of the puzzle is about knowing what will benefit the decisions of a business. We need automated analytics to cut through the clutter and elevate only what matters. Automated analytics takes it a step further and uses a combination of machine learning algorithms and predictive analytics, processes not widely used until recently.
Data is useless without context
‘The amount of data we produce every day is truly mind-boggling. There are 2.5 quintillion bytes of data created each day at our current pace…’ (Forbes)
Mind-boggling is understatement! Comparing data to how many stars there are in the universe! It is apparent we can collect nearly unlimited amounts of data but understanding what is relevant and useful to enhance the performance of an organisation is a different story.
‘Finding patterns is easy in any kind of data- rich environment… The key is determining whether the patterns represent noise or signal.’
Have you ever visited a gallery and your friend can see something totally different in the painting or sculpture to what you can? Data is like a piece of art, not everyone can see the same pattern. It is useful to have multiple sources of data but to actually make sense of it is a different story! The business users and data consumers must create a narrative from the data and identify a pattern. The importance lies with understanding and acting upon the data once it has been brought to life.
Noise and signal
If you could take a minute to remember your Mathematics class at High School. I clearly remember being asked to make a scatter plot with a set of information then asked to interpret the outliers. This is a comparison to the noise or signal found in a data pattern. Once the data is collated into a visualisation it can produce various patterns, any information which is obscure, or irregular is identified as noise or signal. Noise or signal is disruptive, it can sometimes be an outlier in the data set and usually conveying information that should be bought to your attention. This is key in understanding the data story. The data could reveal new revenue opportunities, threats to the business, operational inefficiencies or competitive advantages. The organisation must jump on this to ensure they provide business value and remain competitive in the market.

It is fun to play with data and tell a story with it. However, without having a common objective there is no purpose behind the insights generated. The use of automated analytics, the context of data and finding patterns in the data are crucial when creating and assessing visualisations for business. This qualifies new revenue opportunities, threats to the business, operational inefficiencies or competitive advantages.
A huge thank you to Yellowfin for sponsoring Women in Data, we could not have held such a successful event without the support! We look forward to seeing and hearing from the team at the last WID event of 2018 (December 5th at KPMG Australia)