

Nov 26, 2015
Hey, folks! Thanks for dropping by to check out my first post. No doubt you’ve already seen some fantastic blogs about the subject of Tableau. There are some absolute stunners out there with great content, but I hope mine gives you something else – something about the Tableau journey. Right now I’m lucky enough to have an incredible playground for data – we run a 40 core Tableau Server, and we’ve done all of this in just 18 months! Yep, it grows like wildfire.
I’ve been fortunate to chat with some different people from across the globe, and we all seem to have similar experiences with our Tableau journeys. Paul Banoub summarised it best in his TC15 wrap-up blog when he concluded that ‘This is not the norm”, the software, the community and the experience. If you’re new to Tableau or you’re keen to learn more about the leading visualisation tool, then strap in and get ready for some insight into what I’ve discovered and experienced.
SO WHERE DID I START?
Well, long before Tableau I was an SAS geek. You name it; I’d coded it. SAS was a tool that enabled me to do some funky things with data. I’d like to think I can code like a demon!! But, as with all things, when you become known for something, you can end up being a bottleneck. Everyone wants to come to you because you do cool shit! The only thing is if you’re doing similar things, it’s boring. If you’re doing complicated things, you have to say “No” to a lot of other people because your time is consumed with figuring out how to get to get the code perfected, and get the data to tell the story. I also dabbled a bit in data mining, which was ok, but it wasn’t my passion. Then there was a project to design Next Best Activity and Campaign Management within SAP CRM. While I was happy with what I achieved, I wanted to get back to data.
Eventually, I found myself working for Australia’s second largest telecommunications company. Telcos are fun environments they are incredibly vibrant which keeps me engaged. They offered me an opportunity to bring together cross-channel data visualisation for our sales organisation. I didn’t know then, but my life was going to change.
WHY TABLEAU?
We went out to market and invited companies to pitch to build a Dashboard Proof of Concept. There were no requirements from the business and some data in an SQL server database. We didn’t have a lot of coders in our department, and in my experience telcos can be notorious for restructuring, so my goal with introducing new tooling was “I don’t want to make anyone redundant”. Both companies who submitted responses recommended we use Tableau. They were confident we could deliver a POC, and do it without spending money on licensing until we were ready to buy. There was only one problem… we already had QlikView within our SOE.
So why did we build with Tableau? We’ve never had a central group of developers in my department. And when I connected to Tableau it was so fast and easy. I could see we’d be able to have a great platform for analysts with Excel skills that could use the same tool for insights that we’d use to share dashboards that report to our frontline. We’d be able to share data and insight at the pace that our business operates.
SOUNDS GOOD, RIGHT? BUT THEN I GOT STRUCK BY LIGHTNING
It was late in the evening, and my boss had an odd request. He’d called about some interesting problem and asked me to extract the data so he could take a look in Excel. Here’s where I need to tow the party line and give you a story (instead of the actual scenario).
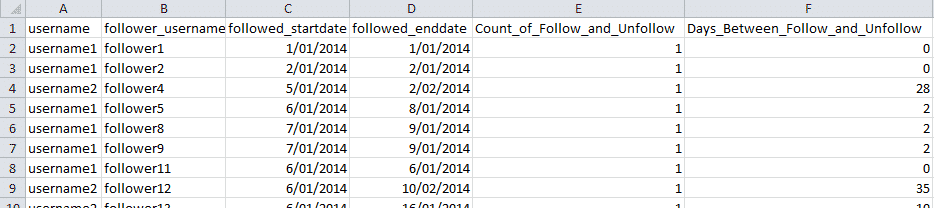
A social company, similar to Twitter, is running a competition to win $1,000,000. The winner is the person who gets the newest followers. That means each new follower = +1. But, there’s no condition saying that the individual still needs to be following you when they do the tally at the end of the competition period, so some people set up fake accounts to follow them, but the social company has auto clean ups to cancel these accounts. There’s another group of entrants who simply do nothing, and people just follow and unfollow randomly. The social company catch on that there may be some questionable behaviour in some of the entrants, so the boss asks me to extract a spreadsheet that shows all conduct of followers for him to review. I extracted something like this:
JOB DONE, RIGHT? WRONG!!!
The call across the floor was “how do I look at this data?”. Wandering over I suggested a pivot table end up with:
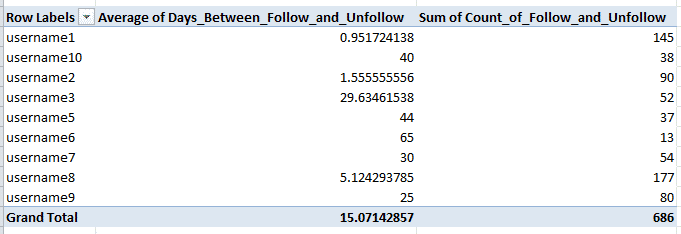
We could see that there were some impressive numbers, but when he asked how he could explain it, I was a bit stumped! Bear in mind, it was late, we’d been doing full days of testing on the data foundation, and while I could see that username1, username2 and username8 had some questionable data, I couldn’t articulate it. I suggested throwing it into Tableau – maybe that would help? With a bit of reluctance, since in his words – “we haven’t even used it yet” I persuaded him I’d try for 5 minutes. I opened Tableau, connected to the data, and in under 3 minutes I had an answer:
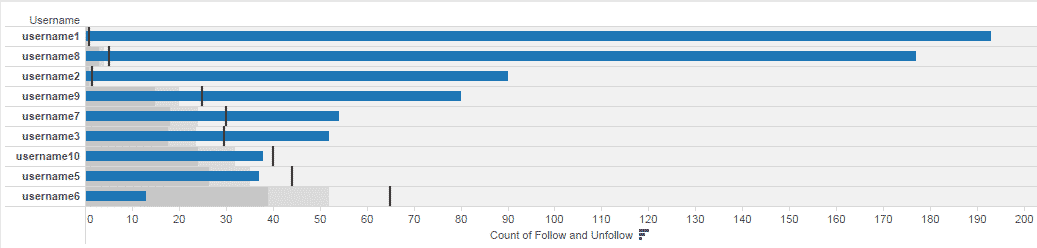
We could quickly see the usernames who had a lot of ‘Follow & Unfollow’ action (the bars), with limited days in between (the vertical reference lines). He cried “Genius!!”, And while I was chuffed I told him “It wasn’t me – it was the tool”. I thought to myself “If Tableau is this simple, everyone can do data”.
That was my Lightning Bolt. I knew I had to adapt or choose another career. I chose to adapt. Looking back, the viz isn’t pretty, and I’d want something different to find the outliers. But, it was enough.. enough for us to challenge our business, to challenge ourselves.
Tableau offers a 14-day free trial license so you can take it for a test drive. Download a copy here (or search the site for the Mac Version) to experience your lightning bolt moment. There’s a stack of free online training on the site, but don’t be scared! You won’t break it, just drag and drop and explore!
THAT’S ALL FROM ME FOR NOW, FOLKS!
I’d love to hear about your journeys. Drop me a line, or comment on here. And be sure to head back if you’re keen to learn about my viz story.
xoxo VizChic
Heads up! This is a personal blog and the opinions expressed here represent my own and not those of my employer.


